How to Use
Jump to where your file located :
cd your_ws/src/matc/matc_pkg/scripts
Run main.py
python3 main.py
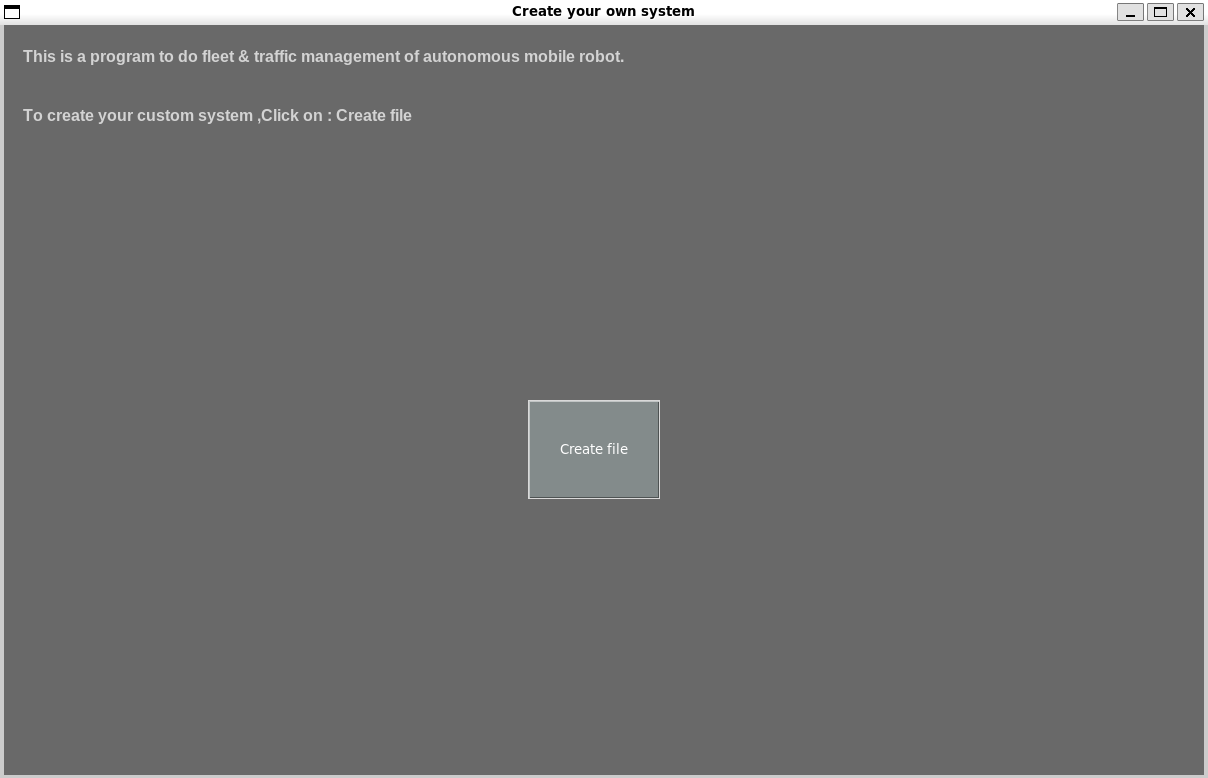
If correct it should be displayed like the image below (This is called ‘main window’). Then press the ‘Create File’ button to go to the next step.
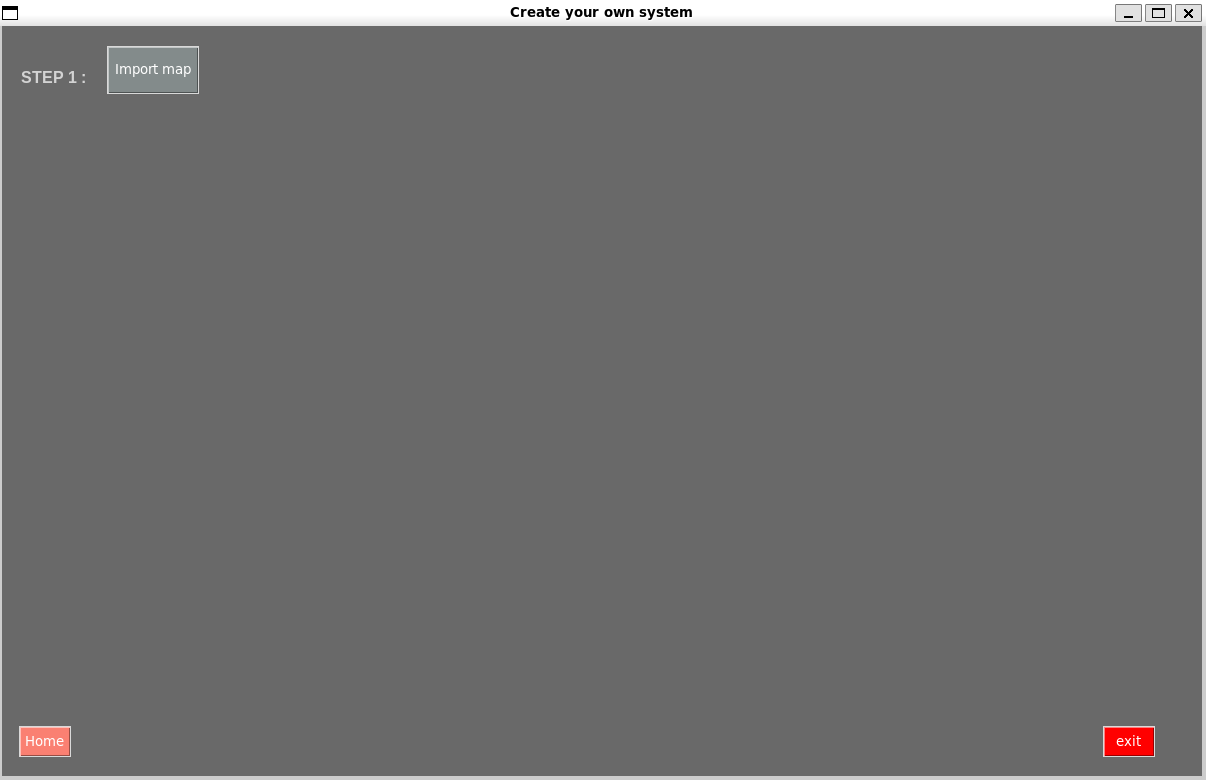
Step1 is step that’s user must import image of map file such as png, jpg, bmp, etc. by click on ‘Import map’ button (The image will be converted from its original size to 800x800 pixels)
When the button is pressed, it displays the following window. Users can select file from where it located then click ‘Open’ or double click on file.

Here is a selected sample map image that will be displayed in a new window with size 800x800 pixel.

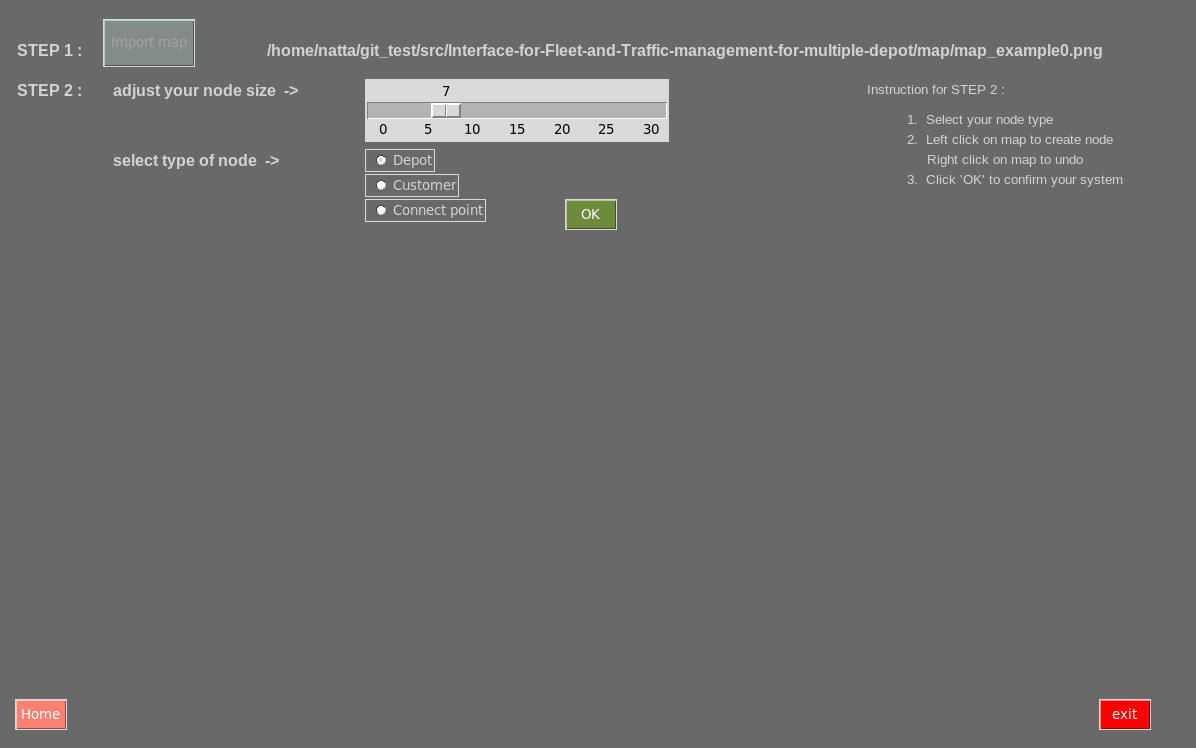
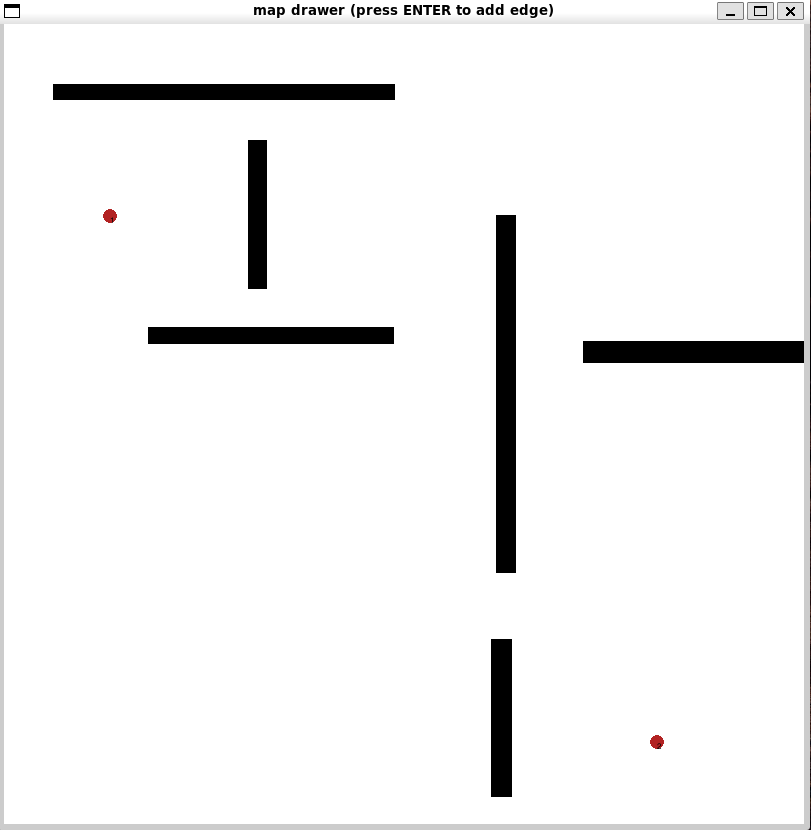
Step2 is step that’s user must draw nodes on an imported map.
There are 3 types of node :
Depot point : The location of the starting point or charging station for the robot. (Red color)
Customer point : The location of the picked up or delivered point which have demand. (Green Color)
Connetor point : It is used as an access point to evade obstacles and determine various positions. (Turquoise color)
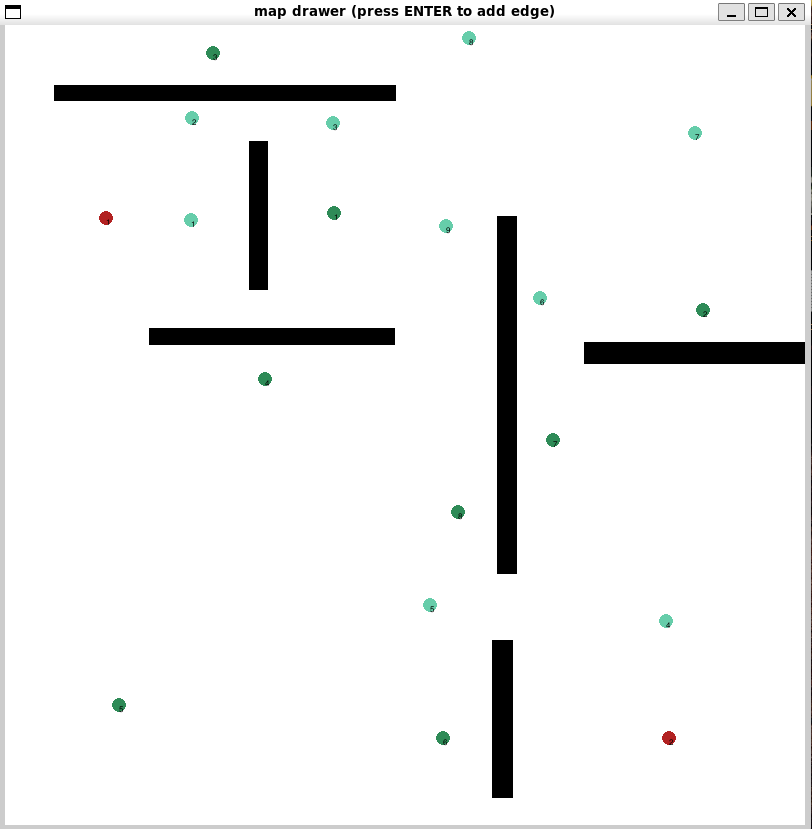
To place the nodes can be done after selecting the type of node and left-click on the window of the imported image (This is called ‘drawing window’),this can be un-pasted last time by right-click. User can also determine the radial size of the nodes. (This depends on the user’s needs and it has no effect on the calculations)
- The requirements for placing nodes are as follows :
All Depot nodes must be placed before other types of nodes.
The placed nodes must not overlap the obstacles on map.
Here is an example of placing nodes on drawing window .
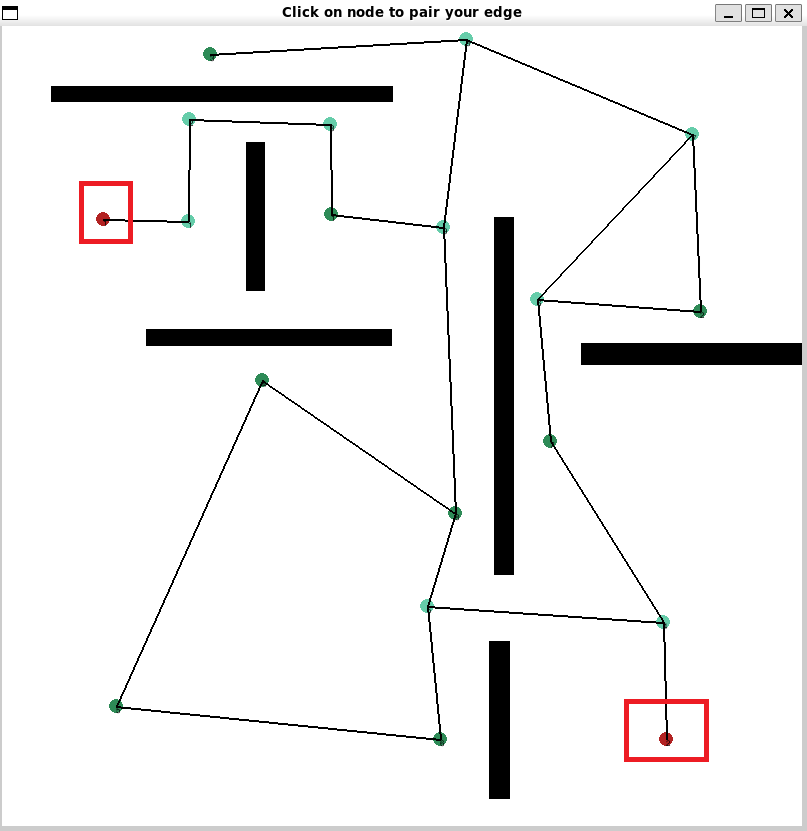
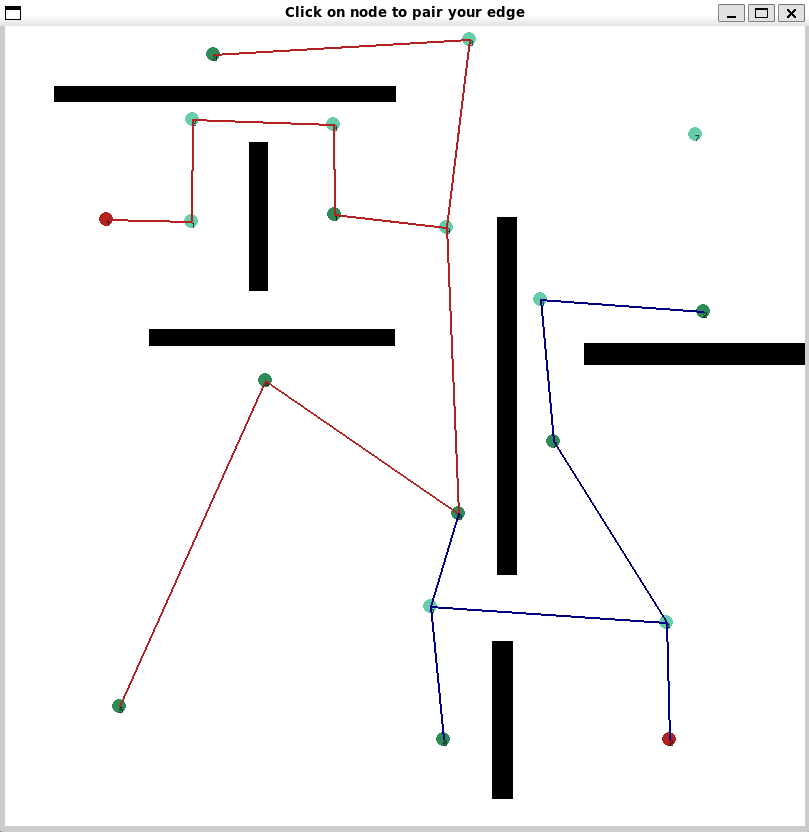
After the nodes are placed on the map, User must press the Enter key to proceed to the next section of this part is “Edge Connection” (the connection path between the nodes). Edge connections can be made by left-click on nodes between two nodes to create paths between them and can be undo by right-click on drawing window.
- The requirements for connection edges are as follows :
Each Depot node can have only one edge.
The edges connected between nodes must not overlap or pass through obstructions.
Here is an example of Edge Connection on drawing window. (The red frame is shown that each Depot node can have only one edge)
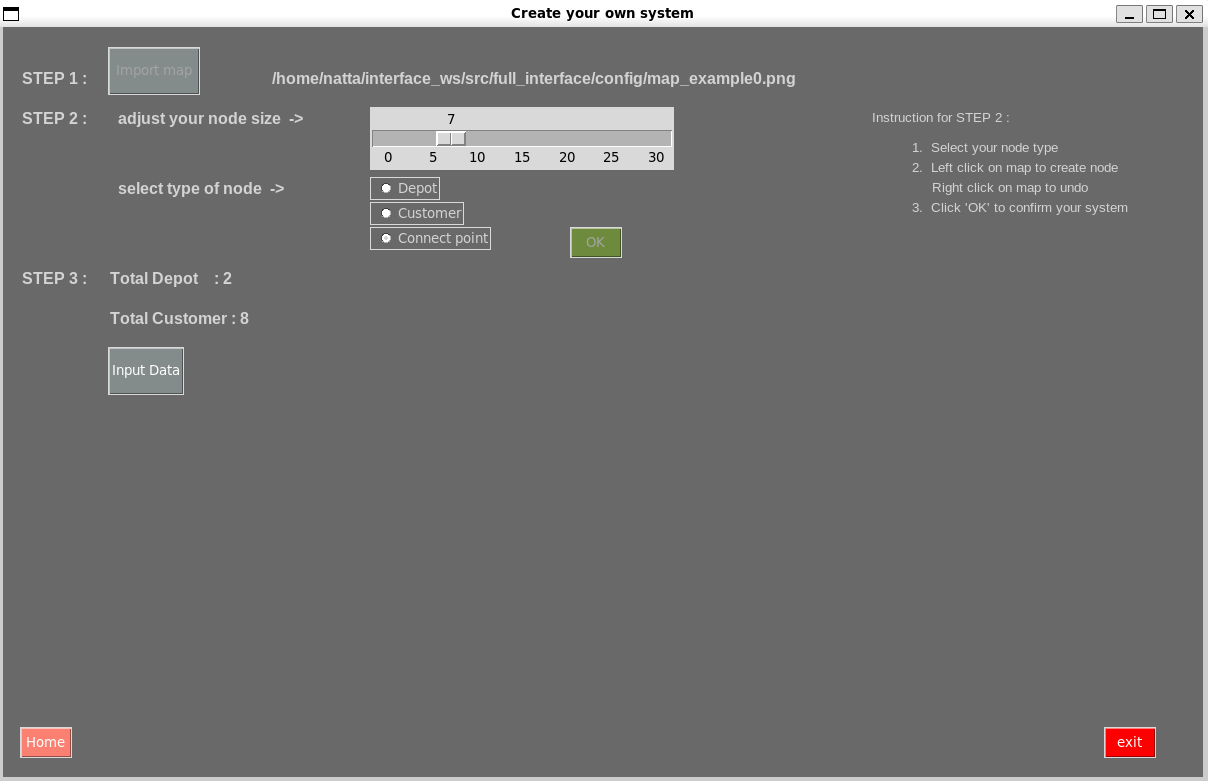
After all the edges are created, User must click on ‘OK’ button in the main window to proceed to next step.
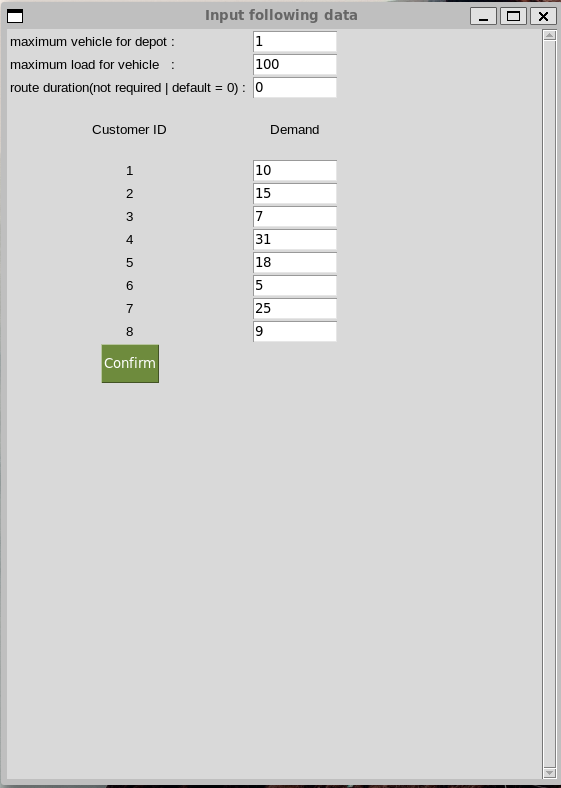
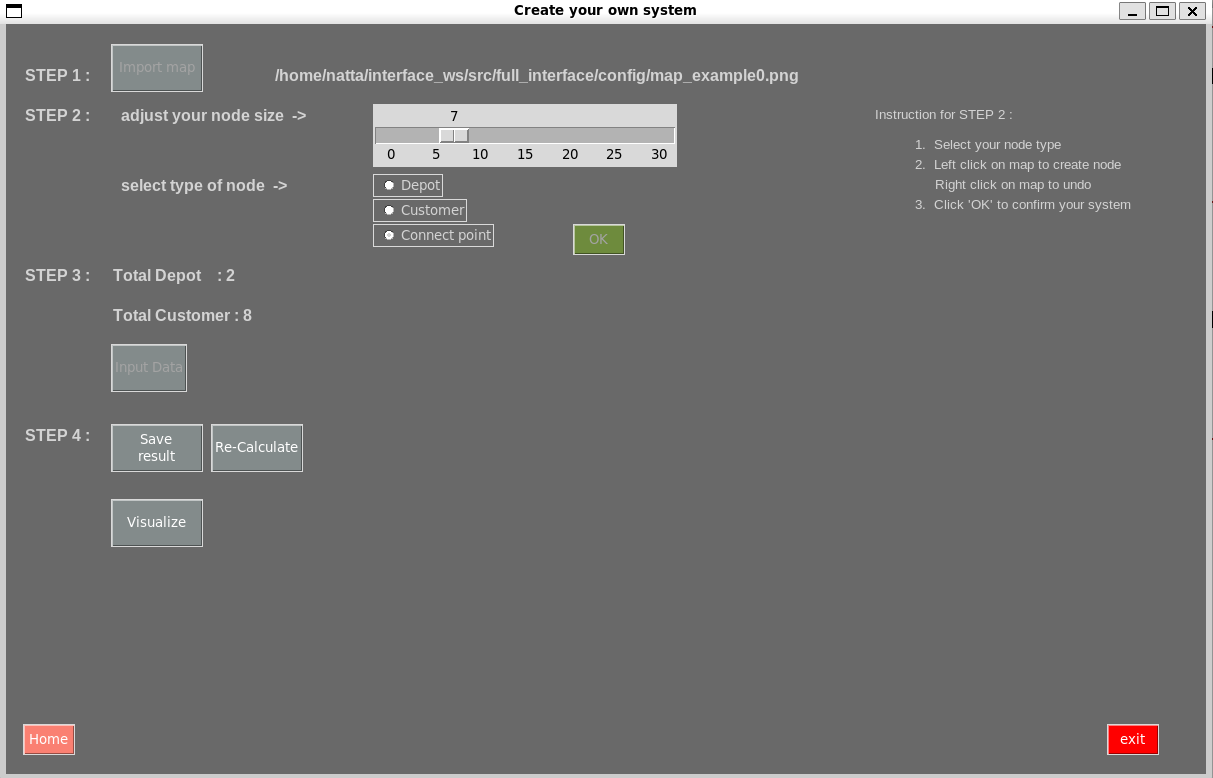
Step3, In the main window will show data that created from Step2 which are amount of total depot and total customer. In this step, user have to input the data about the user’s desired environment by click on ‘Input Data’ button to open input-window.
There are 4 part of input data :
Maximum vehicle for each depot (Amount of maximum vehicle for each depot are equaled)
Maximum load of vehicle (All vehicle load are equaled)
Route duration (Default is 0)
Demand (Demand for each customer point)
When all filling box are filled, user must click on ‘Confirm’ button in an input-window to show result from fleet calculation and proceed to next step.
- The requirements for input data of environment are as follows :
Data in filling box must be integer
Maximum vehicle for each depot must be only 1 (Because of depot is station charge then it can has one vehicle for one station charge)
All filling box must be filled before click on ‘Confirm’ button in an input-window
Here is an example of input-window and result from fleet calculation.
Step4 is a final step. There are 3 buttons in this step :
Re-Calculate : Do fleet calculation again
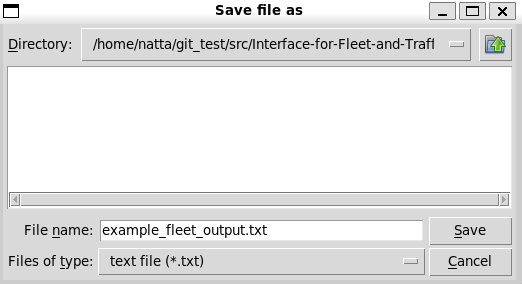
Save result : Save result from fleet calculation in term of List of via points (scale : 800x800) to text file
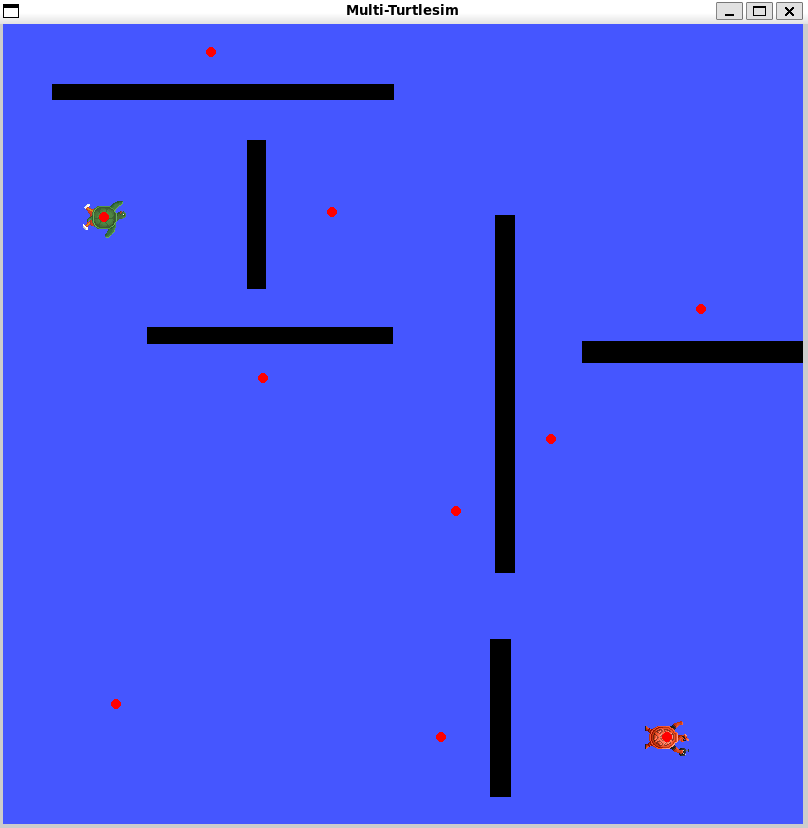
Visualize : visualize on multi-turtlesim-with-traffic-management (This just an example of using traffic management maybe it’s not work perfectly in some cases). Suppose that turtle is vehicle and red point is position of depot and customer point.
Here is an example of Save result
Here is an example of Visualize